Step 1: Accessing the Reports Section
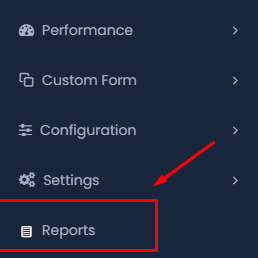
- Navigate to the Sidebar Menu: On the left-hand side of your HRMS dashboard, locate the sidebar menu.
- Select “Reports”: Scroll down to find and click on the “Reports”.
Step 2: Choosing the Employee Report
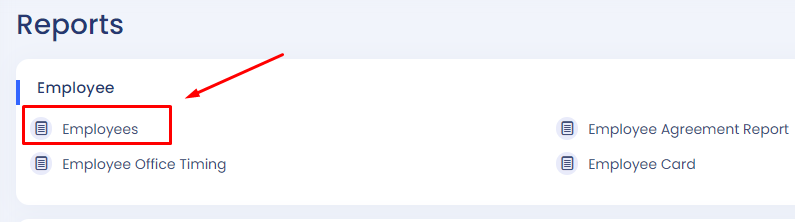
- Select “Employees”: In the Reports section, under the Employee category, click on “Employees” to access the employee report.
Step 3: Filtering Employee Data
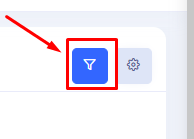
- Click on the Filter Icon: On the employee reports page, click on the filter icon to start filtering your report.
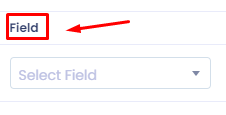
- Choose a Field: From the dropdown menu labeled “Field”, select the specific field you want to filter by (e.g., department, job title, etc.).
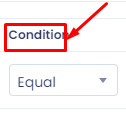
- Set Condition: In the “Condition” dropdown menu, choose the condition (e.g., equal to, not equal to, contains) that fits your filtering needs.
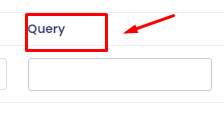
- Enter Query: In the “Query” field, type the value or keyword that corresponds to the selected field and condition.
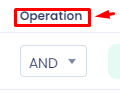
- Operation Selection: Choose an operation such as “AND” or “OR” if you wish to add more filters.
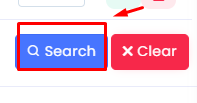
- Click on “Search”: Once you have set all the filters, click on the “Search” button to generate the report based on your criteria.
- Review Report: The filtered report will be displayed on your screen. You can review the data or export it if necessary.
Step 4: Adding Additional Filters
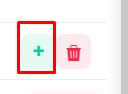
- Add More Filters: If you need to apply additional filters, click on the “+” icon.
Step 5: Selecting Data Columns for the Report
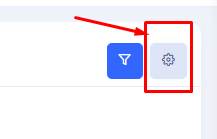
- Action: If you need to customize the columns shown in your requisition list, click on the settings icon.
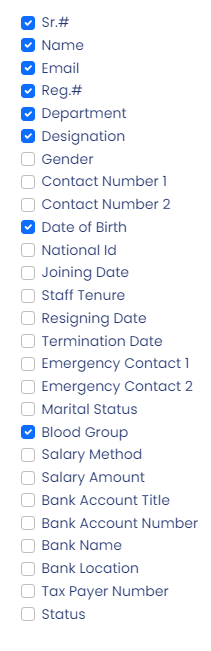
- In the list provided, check or uncheck the boxes next to the fields you want to include, such as “Name,” “Email,” “Department,” “Designation,” etc.
Step 6: Exporting the Report
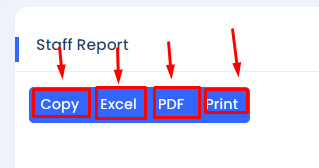
- Choose Export Format: After selecting the necessary fields, you can export the report in your preferred format. The options available are Copy, Excel, PDF, and Print.
- Copy: This option allows you to copy the report data to your clipboard for pasting into another document or application.
- Excel: Exports the report data into an Excel spreadsheet, which is ideal for further data manipulation.
- PDF: Exports the report as a PDF file, suitable for sharing and printing.
- Print: Directly prints the report using your connected printer.
By following these steps, you can effectively generate a customized employee report and export it in various formats for your records or presentations. This process ensures that you have the necessary data tailored to your specific needs.